 Web Server Statistics for donpavlish.com Web Server Statistics for donpavlish.com
(Go To: Top: General Summary: Monthly Report: Weekly Report: Daily Report: Daily Summary: Hourly Summary: Domain Report: Organisation Report: Host Report: Referrer Report: Search Query Report: Search Word Report: Browser Summary: Operating System Report: Failure Report: Request Report)
This report contains overall statistics.
(Figures in parentheses refer to the 7-day period ending
11-Oct-2007 00:18).
Successful requests: 4,328 (328)
Average successful requests per day: 48 (46)
Successful requests for pages: 4,116 (314)
Average successful requests for pages per day: 45 (44)
Failed requests: 31 (4)
Redirected requests: 1,779 (114)
Distinct files requested: 118 (7)
Distinct hosts served: 981 (135)
Unwanted logfile entries: 1,885
Data transferred: 15.38 megabytes (572.12 kilobytes)
Average data transferred per day: 175.07 kilobytes (81.73 kilobytes)
(Go To: Top: General Summary: Monthly Report: Weekly Report: Daily Report: Daily Summary: Hourly Summary: Domain Report: Organisation Report: Host Report: Referrer Report: Search Query Report: Search Word Report: Browser Summary: Operating System Report: Failure Report: Request Report)
This report lists the activity in each month.
Each unit ( ) represents 40 requests
for pages or part thereof.
) represents 40 requests
for pages or part thereof.
month: reqs: pages: --------: ----: -----: Jul 2007: 853: 815:Busiest month: Sep 2007 (1,488 requests for pages).Oct 2007: 473: 450:

(Go To: Top: General Summary: Monthly Report: Weekly Report: Daily Report: Daily Summary: Hourly Summary: Domain Report: Organisation Report: Host Report: Referrer Report: Search Query Report: Search Word Report: Browser Summary: Operating System Report: Failure Report: Request Report)
This report lists the activity in each week.
Each unit () represents 15 requests
for pages or part thereof.
week beg.: reqs: pages: ---------: ----: -----: 8/Jul/07: 55: 54:Busiest week: week beginning 2/Sep/07 (449 requests for pages).22/Jul/07: 294: 284:
(Go To: Top: General Summary: Monthly Report: Weekly Report: Daily Report: Daily Summary: Hourly Summary: Domain Report: Organisation Report: Host Report: Referrer Report: Search Query Report: Search Word Report: Browser Summary: Operating System Report: Failure Report: Request Report)
This report lists the activity in each day.
Each unit () represents 6 requests
for pages or part thereof.
date: reqs: pages: ---------: ----: -----: 30/Aug/07: 36: 34:Busiest day: 4/Sep/07 (234 requests for pages).
(Go To: Top: General Summary: Monthly Report: Weekly Report: Daily Report: Daily Summary: Hourly Summary: Domain Report: Organisation Report: Host Report: Referrer Report: Search Query Report: Search Word Report: Browser Summary: Operating System Report: Failure Report: Request Report)
This report lists the total activity for each day of the week, summed over all the weeks in the report.
Each unit () represents 15 requests
for pages or part thereof.
day: reqs: pages: ---: ----: -----: Sun: 681: 669:
(Go To: Top: General Summary: Monthly Report: Weekly Report: Daily Report: Daily Summary: Hourly Summary: Domain Report: Organisation Report: Host Report: Referrer Report: Search Query Report: Search Word Report: Browser Summary: Operating System Report: Failure Report: Request Report)
This report lists the total activity for each hour of the day, summed over all the days in the report.
Each unit () represents 6 requests
for pages or part thereof.
hour: reqs: pages: ----: ----: -----: 0: 177: 175:7: 188: 181:
(Go To: Top: General Summary: Monthly Report: Weekly Report: Daily Report: Daily Summary: Hourly Summary: Domain Report: Organisation Report: Host Report: Referrer Report: Search Query Report: Search Word Report: Browser Summary: Operating System Report: Failure Report: Request Report)
This report lists the countries of the computers which requested files.
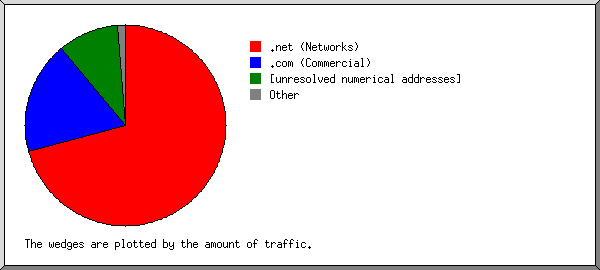
Listing domains, sorted by the amount of traffic.
reqs: %bytes: domain
----: ------: ------
2675: 70.75%: .net (Networks)
 912: 18.23%: .com (Commercial)
 474:  9.90%: [unresolved numerical addresses]
  56:  0.25%: [unknown domain]
  32:  0.15%: .edu (USA Higher Education)
  19:  0.07%: .ca (Canada)
  28:  0.07%: .de (Germany)
  12:  0.05%: .sc (Seychelles)
  11:  0.05%: .jp (Japan)
  10:  0.05%: .tw (Taiwan)
   9:  0.04%: .uk (United Kingdom)
   9:  0.04%: .nl (Netherlands)
   9:  0.04%: .cn (China)
   8:  0.04%: .cz (Czech Republic)
   6:  0.03%: .info (Informational)
   6:  0.03%: .tr (Turkey)
   6:  0.02%: .au (Australia)
   5:  0.02%: .org (Non Profit Making Organisations)
   5:  0.02%: .ru (Russia)
   4:  0.02%: .ie (Ireland)
   3:  0.01%: .us (United States)
   3:  0.01%: .id (Indonesia)
   3:  0.01%: .se (Sweden)
   2:  0.01%: .ro (Romania)
   2:  0.01%: .br (Brazil)
   2:  0.01%: .my (Malaysia)
   2:  0.01%: .fr (France)
   2:  0.01%: .pl (Poland)
   2:  0.01%: .no (Norway)
   1:       : .aero (Air Transport Industry)
   1:       : .yu (Yugoslavia)
   1:       : .hk (Hong Kong)
   1:       : [domain not given]
   1:       : .th (Thailand)
   1:       : .nz (New Zealand)
   1:       : .gov (USA Government)
   1:       : .sg (Singapore)
   1:       : .dk (Denmark)
   1:       : .hr (Croatia)
   1:       : .biz (Businesses)
(Go To: Top: General Summary: Monthly Report: Weekly Report: Daily Report: Daily Summary: Hourly Summary: Domain Report: Organisation Report: Host Report: Referrer Report: Search Query Report: Search Word Report: Browser Summary: Operating System Report: Failure Report: Request Report)
This report lists the organisations of the computers which requested files.
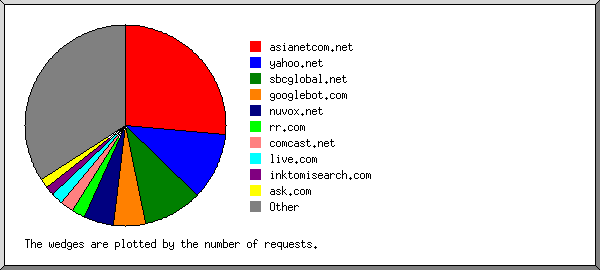
Listing the top 20 organisations by the number of requests, sorted by the number of requests.
reqs: %bytes: organisation
----: ------: ------------
1147:  4.92%: asianetcom.net
 464:  1.81%: yahoo.net
 411: 44.49%: sbcglobal.net
 224:  1.13%: googlebot.com
 202: 11.43%: nuvox.net
  98:  8.75%: rr.com
  92:  3.89%: comcast.net
  81:  0.57%: live.com
  66:  0.25%: inktomisearch.com
  60:  0.39%: ask.com
  60:  4.41%: guardianservices.com
  56:  0.25%: [unknown domain]
  55:  6.79%: 166.77
  50:  0.78%: verizon.net
  39:  1.01%: cox.net
  38:  0.17%: 65.214
  33:  0.13%: twtelecom.net
  29:  0.12%: charter.com
  25:  0.11%: 193.95
  25:  0.12%: ucr.edu
1073:  8.49%: [not listed: 398 organisations]
(Go To: Top: General Summary: Monthly Report: Weekly Report: Daily Report: Daily Summary: Hourly Summary: Domain Report: Organisation Report: Host Report: Referrer Report: Search Query Report: Search Word Report: Browser Summary: Operating System Report: Failure Report: Request Report)
This report lists the computers which requested files.
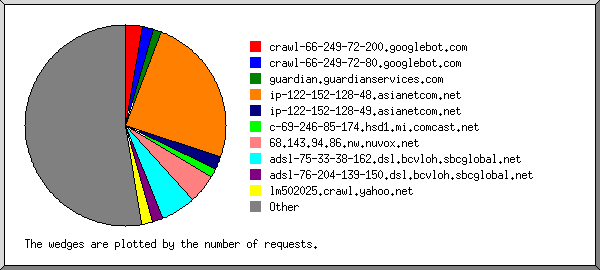
Listing the top 50 hosts by the number of requests, sorted alphabetically.
reqs: %bytes: host
----: ------: ----
  38:  0.17%: 65.214.39.180
  55:  6.79%: 166.77.6.4
  25:  0.11%: 193.95.154.69
  20:  0.08%: 202.179.180.45
  11:  0.05%: 209.249.86.17
  14:  0.06%: 210.82.118.14
  11:  0.05%: 221.223.209.38
  20:  0.09%:                          xcrawl101.alexa.com
  10:  0.05%:                          crawler2010.ask.com
  15:  0.06%:                           egspd42415.ask.com
 124:  0.73%:            crawl-66-249-72-200.googlebot.com
  20:  0.08%:             crawl-66-249-72-71.googlebot.com
  74:  0.29%:             crawl-66-249-72-80.googlebot.com
  60:  4.41%:                guardian.guardianservices.com
  20:  0.08%:                   lj910357.inktomisearch.com
  22:  0.09%:                   lj910581.inktomisearch.com
  20:  0.09%:         livebot-207-46-98-38.search.live.com
  14:  0.06%:         livebot-65-55-209-20.search.live.com
  11:  7.77%:               cpe-74-64-17-21.nyc.res.rr.com
  11:  0.05%:                         nat240.webtrends.com
  17:  0.02%:                                   tschild.de
  25:  0.12%:                              scruffy.ucr.edu
  20:  0.09%:                        bl1sch2041710.phx.gbl
  12:  0.06%:                        bl1sch2043708.phx.gbl
  22:  0.09%:                        by1sch4030213.phx.gbl
  12:  0.05%:             ip-122-152-128-16.asianetcom.net
1047:  4.49%:             ip-122-152-128-48.asianetcom.net
  88:  0.38%:             ip-122-152-128-49.asianetcom.net
  61:  3.40%:          c-69-246-85-174.hsd1.mi.comcast.net
  14:  0.06%:              wsip-70-169-191-4.sb.sd.cox.net
  20:  0.03%:                natcrawlbloc01.net.m1.fti.net
 202: 11.43%:                    68.143.94.86.nw.nuvox.net
  32:  2.39%:   adsl-75-33-35-208.dsl.bcvloh.sbcglobal.net
 243: 27.41%:   adsl-75-33-38-162.dsl.bcvloh.sbcglobal.net
  71:  5.07%: adsl-76-204-139-150.dsl.bcvloh.sbcglobal.net
  10:  0.38%: pool-71-106-180-123.lsanca.dsl-w.verizon.net
  19:  0.08%:                     lj511060.crawl.yahoo.net
  29:  0.14%:                     lj511138.crawl.yahoo.net
  15:  0.04%:                     lj511145.crawl.yahoo.net
  13:  0.06%:                     lj511178.crawl.yahoo.net
  19:  0.08%:                     lj511488.crawl.yahoo.net
  19:  0.05%:                     lj511573.crawl.yahoo.net
  47:  0.19%:                     lj512275.crawl.yahoo.net
  13:  0.05%:                     lj611015.crawl.yahoo.net
  14:  0.06%:                     lj611935.crawl.yahoo.net
  28:  0.10%:                     lj612376.crawl.yahoo.net
  40:  0.16%:                     lj612377.crawl.yahoo.net
  20:  0.09%:                     lm302015.crawl.yahoo.net
  80:  0.34%:                     lm502025.crawl.yahoo.net
  12:  0.05%:                                 www.whois.sc
1469: 21.87%: [not listed: 931 hosts]
(Go To: Top: General Summary: Monthly Report: Weekly Report: Daily Report: Daily Summary: Hourly Summary: Domain Report: Organisation Report: Host Report: Referrer Report: Search Query Report: Search Word Report: Browser Summary: Operating System Report: Failure Report: Request Report)
This report lists the referrers (where people followed links from, or pages which included this site's images).
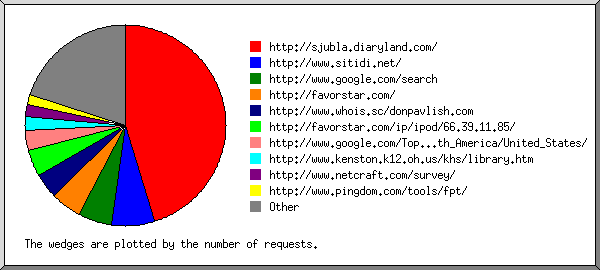
Listing referring URLs with at least 2 requests, sorted by the number of requests.
reqs: URL
----: ---
 140: http://sjubla.diaryland.com/
  21: http://www.sitidi.net/
  17: http://www.google.com/search
  15: http://favorstar.com/
  13: http://www.whois.sc/donpavlish.com
  13: http://favorstar.com/ip/ipod/66.39.11.85/
  10: http://www.google.com/Top/Business/Business_Services/Design/Graphic_Design/Designers/Multi-Discipline/Freelance/North_America/United_States/
   7: http://www.kenston.k12.oh.us/khs/library.htm
   6: http://www.netcraft.com/survey/
   5: http://www.pingdom.com/tools/fpt/
   4: http://www.mindychildress.com/blog/
   4: http://www.donsbosspage.com/stealth_index.shtml
   4: http://favorstar.com/domain/hosting/server/web/www.donpavlish.com/
   3: http://www.donsbosspage.com/protector.shtml
   2: http://www.donsbosspage.com/sites.shtml
   2: http://tags2dir.com/directory/
   2: http://www.clevelandrocks.com/sites/index.php
   2: http://www.donsbosspage.com/sounds.shtml
   2: http://donpavlish.com/robots.txt
   2: http://search.live.com/results.aspx
   2: http://www.bainbridgetwp.com/credits.php
   2: http://www.munax.com/referer.htm
  31: [not listed: 31 URLs]
(Go To: Top: General Summary: Monthly Report: Weekly Report: Daily Report: Daily Summary: Hourly Summary: Domain Report: Organisation Report: Host Report: Referrer Report: Search Query Report: Search Word Report: Browser Summary: Operating System Report: Failure Report: Request Report)
This report lists which queries people used in search engines to find the site.
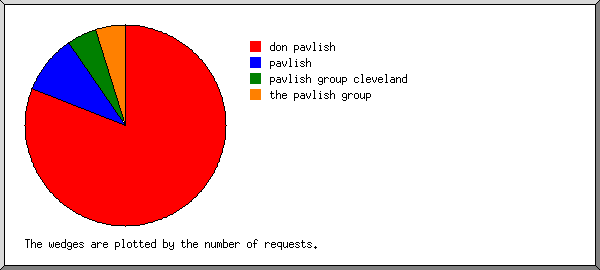
Listing queries, sorted by the number of requests.
reqs: search term
----: -----------
  17: don pavlish
   2: pavlish
   1: pavlish group cleveland
   1: the pavlish group
(Go To: Top: General Summary: Monthly Report: Weekly Report: Daily Report: Daily Summary: Hourly Summary: Domain Report: Organisation Report: Host Report: Referrer Report: Search Query Report: Search Word Report: Browser Summary: Operating System Report: Failure Report: Request Report)
This report lists which words people used in search engines to find the site.
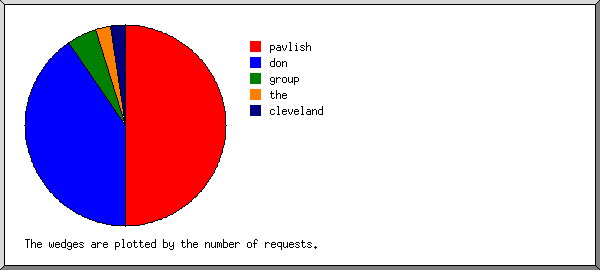
Listing query words, sorted by the number of requests.
reqs: search term
----: -----------
  21: pavlish
  17: don
   2: group
   1: the
   1: cleveland
(Go To: Top: General Summary: Monthly Report: Weekly Report: Daily Report: Daily Summary: Hourly Summary: Domain Report: Organisation Report: Host Report: Referrer Report: Search Query Report: Search Word Report: Browser Summary: Operating System Report: Failure Report: Request Report)
This report lists the vendors of visitors' browsers.

Listing the top 20 browsers by the number of requests for pages, sorted by the number of requests for pages.
no.: reqs: pages: browser
---: ----: -----: -------
  1: 1147:  1147: Baiduspider+(+http:
   : 1147:  1147:   Baiduspider+(+http://www
  2:  872:   870: Netscape (compatible)
  3:  897:   772: MSIE
   :  522:   522:   MSIE/5
   :  247:   195:   MSIE/6
   :  126:    53:   MSIE/7
   :    1:     1:   MSIE/3
  4:  762:   708: Mozilla
   :  735:   681:   Mozilla/1
  5:  114:   114: msnbot
   :  114:   114:   msnbot/1
  6:  131:   112: Safari
   :   78:    75:   Safari/312
   :   48:    33:   Safari/419
   :    4:     4:   Safari/522
  7:   31:    31: Konqueror
   :   31:    31:   Konqueror/3
  8:   32:    30: msnbot-media
   :   32:    30:   msnbot-media/1
  9:   25:    25: DataFountains
   :   25:    25:   DataFountains/DMOZ
 10:   20:    20: ia_archiver
 11:   17:    17: SBIder
   :   17:    17:   SBIder/SBIder-0
 12:   15:    15: favorstarbot
   :   15:    15:   favorstarbot/1
 13:   14:    14: envolk
   :   14:    14:   envolk/1
 14:   13:    13: SurveyBot
   :   13:    13:   SurveyBot/2
 15:   13:    12: Netscape
   :    6:     6:   Netscape/4
   :    4:     3:   Netscape/7
 16:    8:     8: Java
   :    8:     8:   Java/1
 17:    8:     8: MSRBOT (http:
   :    8:     8:   MSRBOT (http://research
 18:    7:     7: Speedy Spider (http:
   :    7:     7:   Speedy Spider (http://www
 19:    7:     7: Sirketcebot
   :    7:     7:   Sirketcebot/v
 20:    6:     6: VadixBot
   :  117:   108: [not listed: 57 browsers]
(Go To: Top: General Summary: Monthly Report: Weekly Report: Daily Report: Daily Summary: Hourly Summary: Domain Report: Organisation Report: Host Report: Referrer Report: Search Query Report: Search Word Report: Browser Summary: Operating System Report: Failure Report: Request Report)
This report lists the operating systems used by visitors.
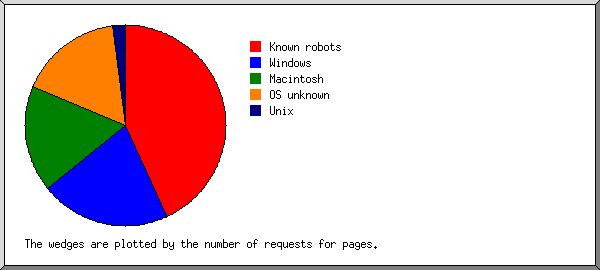
Listing operating systems, sorted by the number of requests for pages.
no.: reqs: pages: OS
---: ----: -----: --
  1: 1754:  1745: Known robots
  2:  974:   843: Windows
   :  521:   521:   Windows 98
   :  372:   242:   Windows XP
   :   48:    47:   Windows 2000
   :   31:    31:   Unknown Windows
   :    1:     1:   Windows ME
   :    1:     1:   Windows NT
  3:  765:   697: Macintosh
  4:  680:   676: OS unknown
  5:   83:    83: Unix
   :   83:    83:   Linux
(Go To: Top: General Summary: Monthly Report: Weekly Report: Daily Report: Daily Summary: Hourly Summary: Domain Report: Organisation Report: Host Report: Referrer Report: Search Query Report: Search Word Report: Browser Summary: Operating System Report: Failure Report: Request Report)
This report lists the files that caused failures, for example files not found.
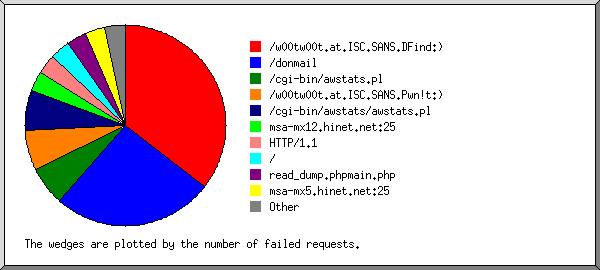
Listing files, sorted by the number of failed requests.
reqs: file
----: ----
  11: /w00tw00t.at.ISC.SANS.DFind:)
   8: /donmail
   2: /cgi-bin/awstats.pl
   2: /w00tw00t.at.ISC.SANS.Pwn!t:)
   2: /cgi-bin/awstats/awstats.pl
   1: msa-mx12.hinet.net:25
   1: HTTP/1.1
   1: /
   1: read_dump.phpmain.php
   1: msa-mx5.hinet.net:25
   1: /cgi-bin/stats/awstats.pl
(Go To: Top: General Summary: Monthly Report: Weekly Report: Daily Report: Daily Summary: Hourly Summary: Domain Report: Organisation Report: Host Report: Referrer Report: Search Query Report: Search Word Report: Browser Summary: Operating System Report: Failure Report: Request Report)
This report lists the files on the site.
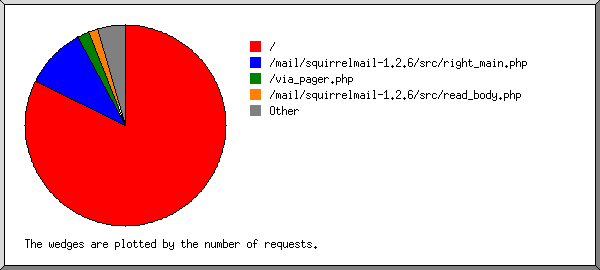
Listing files with at least 20 requests, sorted by the number of requests.
reqs: %bytes:       last time: file
----: ------: ---------------: ----
3385: 23.94%: 10/Oct/07 22:40: /
 409: 62.68%: 26/Sep/07 10:57: /mail/squirrelmail-1.2.6/src/right_main.php
 199: 31.75%: 16/Sep/07 08:36:   /mail/squirrelmail-1.2.6/src/right_main.php?sort=6&startMessage=1&mailbox=INBOX
 145: 21.01%: 16/Sep/07 08:21:   /mail/squirrelmail-1.2.6/src/right_main.php?PG_SHOWALL=0&sort=0&startMessage=1&mailbox=INBOX
  79:  0.59%: 10/Oct/07 10:13: /via_pager.php
  63:  7.34%: 26/Sep/07 10:57: /mail/squirrelmail-1.2.6/src/read_body.php
  36:  0.64%: 26/Sep/07 10:56: /mail/squirrelmail-1.2.6/src/left_main.php
  35:  0.26%:  9/Oct/07 03:23: /project_management.php
  22:  0.43%: 26/Sep/07 10:56: /mail/squirrelmail-1.2.6/src/login.php
  87:  4.12%:  8/Oct/07 19:37: [not listed: 13 files]
(Go To: Top: General Summary: Monthly Report: Weekly Report: Daily Report: Daily Summary: Hourly Summary: Domain Report: Organisation Report: Host Report: Referrer Report: Search Query Report: Search Word Report: Browser Summary: Operating System Report: Failure Report: Request Report)

