 Web Server Statistics for Don's Web Stuff at Pair Web Server Statistics for Don's Web Stuff at Pair
(Go To: Top: General Summary: Monthly Report: Weekly Report: Daily Report: Daily Summary: Hourly Summary: Domain Report: Organisation Report: Host Report: Directory Report: Failure Report: Request Report)
This report contains overall statistics.
(Figures in parentheses refer to the 7-day period ending
11-Oct-2007 00:18).
Successful requests: 25 (1)
Successful requests for pages: 25 (1)
Failed requests: 23 (4)
Redirected requests: 1,225 (69)
Distinct files requested: 3 (1)
Distinct hosts served: 24 (1)
Unwanted logfile entries: 80
Data transferred: 22.02 kilobytes (1.00 kilobytes)
Average data transferred per day: 251 bytes (146 bytes)
(Go To: Top: General Summary: Monthly Report: Weekly Report: Daily Report: Daily Summary: Hourly Summary: Domain Report: Organisation Report: Host Report: Directory Report: Failure Report: Request Report)
This report lists the activity in each month.
Each unit ( ) represents 1 request
for a page.
) represents 1 request
for a page.
month: reqs: pages: --------: ----: -----: Jul 2007: 2: 2:Busiest month: Sep 2007 (17 requests for pages).Aug 2007: 5: 5:
(Go To: Top: General Summary: Monthly Report: Weekly Report: Daily Report: Daily Summary: Hourly Summary: Domain Report: Organisation Report: Host Report: Directory Report: Failure Report: Request Report)
This report lists the activity in each week.
Each unit () represents 1 request
for a page.
week beg.: reqs: pages: ---------: ----: -----: 15/Jul/07: 2: 2:Busiest week: week beginning 9/Sep/07 (12 requests for pages).16/Sep/07: 3: 3:
(Go To: Top: General Summary: Monthly Report: Weekly Report: Daily Report: Daily Summary: Hourly Summary: Domain Report: Organisation Report: Host Report: Directory Report: Failure Report: Request Report)
This report lists the activity in each day.
Each unit () represents 1 request
for a page.
date: reqs: pages: ---------: ----: -----: 25/Aug/07: 0: 0: 26/Aug/07: 0: 0: 27/Aug/07: 0: 0: 28/Aug/07: 0: 0: 29/Aug/07: 0: 0: 30/Aug/07: 0: 0: 31/Aug/07: 0: 0: 1/Sep/07: 0: 0: 2/Sep/07: 0: 0: 3/Sep/07: 0: 0: 4/Sep/07: 0: 0: 5/Sep/07: 0: 0: 6/Sep/07: 0: 0: 7/Sep/07: 0: 0: 8/Sep/07: 0: 0: 9/Sep/07: 1: 1:Busiest day: 10/Sep/07 (8 requests for pages).11/Sep/07: 1: 1:
(Go To: Top: General Summary: Monthly Report: Weekly Report: Daily Report: Daily Summary: Hourly Summary: Domain Report: Organisation Report: Host Report: Directory Report: Failure Report: Request Report)
This report lists the total activity for each day of the week, summed over all the weeks in the report.
Each unit () represents 1 request
for a page.
day: reqs: pages: ---: ----: -----: Sun: 1: 1:
(Go To: Top: General Summary: Monthly Report: Weekly Report: Daily Report: Daily Summary: Hourly Summary: Domain Report: Organisation Report: Host Report: Directory Report: Failure Report: Request Report)
This report lists the total activity for each hour of the day, summed over all the days in the report.
Each unit () represents 1 request
for a page.
hour: reqs: pages: ----: ----: -----: 0: 2: 2:
(Go To: Top: General Summary: Monthly Report: Weekly Report: Daily Report: Daily Summary: Hourly Summary: Domain Report: Organisation Report: Host Report: Directory Report: Failure Report: Request Report)
This report lists the countries of the computers which requested files.
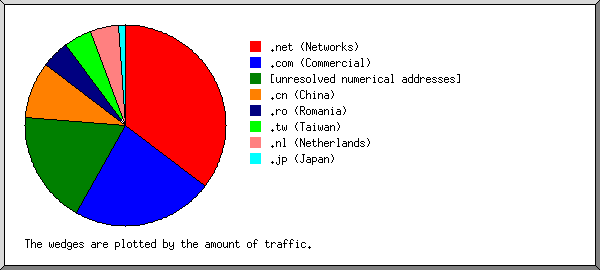
Listing domains, sorted by the amount of traffic.
reqs: %bytes: domain
----: ------: ------
   8: 35.30%: .net (Networks)
   7: 22.73%: .com (Commercial)
   4: 18.10%: [unresolved numerical addresses]
   2:  9.17%: .cn (China)
   1:  4.55%: .ro (Romania)
   1:  4.55%: .tw (Taiwan)
   1:  4.55%: .nl (Netherlands)
   1:  1.06%: .jp (Japan)
(Go To: Top: General Summary: Monthly Report: Weekly Report: Daily Report: Daily Summary: Hourly Summary: Domain Report: Organisation Report: Host Report: Directory Report: Failure Report: Request Report)
This report lists the organisations of the computers which requested files.
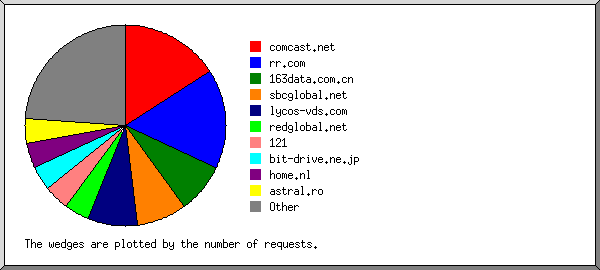
Listing organisations, sorted by the number of requests.
reqs: %bytes: organisation
----: ------: ------------
   4: 17.12%: comcast.net
   4: 18.18%: rr.com
   2:  9.17%: 163data.com.cn
   2:  9.09%: sbcglobal.net
   2:       : lycos-vds.com
   1:  4.55%: redglobal.net
   1:  4.55%: 121
   1:  1.06%: bit-drive.ne.jp
   1:  4.55%: home.nl
   1:  4.55%: astral.ro
   1:  4.55%: totalbb.net.tw
   1:  4.55%: llnw.net
   1:  4.55%: charter.com
   1:  4.55%: 80.78
   1:  4.46%: 211.99
   1:  4.55%: 61.50
(Go To: Top: General Summary: Monthly Report: Weekly Report: Daily Report: Daily Summary: Hourly Summary: Domain Report: Organisation Report: Host Report: Directory Report: Failure Report: Request Report)
This report lists the computers which requested files.
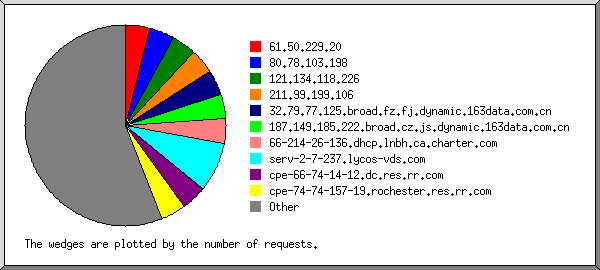
Listing hosts, sorted alphabetically.
reqs: %bytes: host
----: ------: ----
   1:  4.55%: 61.50.229.20
   1:  4.55%: 80.78.103.198
   1:  4.55%: 121.134.118.226
   1:  4.46%: 211.99.199.106
   1:  4.46%:    32.79.77.125.broad.fz.fj.dynamic.163data.com.cn
   1:  4.71%: 187.149.185.222.broad.cz.js.dynamic.163data.com.cn
   1:  4.55%:             66-214-26-136.dhcp.lnbh.ca.charter.com
   2:       :                         serv-2-7-237.lycos-vds.com
   1:  4.55%:                      cpe-66-74-14-12.dc.res.rr.com
   1:  4.55%:              cpe-74-74-157-19.rochester.res.rr.com
   1:  4.55%:                   cpe-67-11-26-220.satx.res.rr.com
   1:  4.55%:                   cpe-66-24-74-248.stny.res.rr.com
   1:  1.06%:                219-118-162-10.cust.bit-drive.ne.jp
   1:  4.55%:                 c-76-103-91-88.hsd1.ca.comcast.net
   1:  4.55%:                 c-76-20-68-109.hsd1.ca.comcast.net
   1:  3.48%:               c-66-176-145-215.hsd1.fl.comcast.net
   1:  4.55%:                c-66-229-26-190.hsd1.fl.comcast.net
   1:  4.55%:                              fcds508.phx3.llnw.net
   1:  4.55%:                             mercurio.redglobal.net
   1:  4.55%:        adsl-70-232-19-151.dsl.irvnca.sbcglobal.net
   1:  4.55%:        adsl-70-234-163-95.dsl.tul2ok.sbcglobal.net
   1:  4.55%:                         cc991721-b.hdb1.ov.home.nl
   1:  4.55%:                            home-323880.b.astral.ro
   1:  4.55%:          host-42.49-151-202.dynamic.totalbb.net.tw
(Go To: Top: General Summary: Monthly Report: Weekly Report: Daily Report: Daily Summary: Hourly Summary: Domain Report: Organisation Report: Host Report: Directory Report: Failure Report: Request Report)
This report lists the directories from which files were requested. (The figures for each directory include all of its subdirectories.)
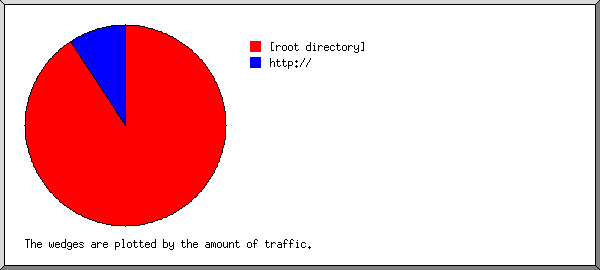
Listing directories with at least 0.01% of the traffic, sorted by the amount of traffic.
reqs: %bytes: directory
----: ------: ---------
  23: 90.83%: [root directory]
   2:  9.17%: http://
(Go To: Top: General Summary: Monthly Report: Weekly Report: Daily Report: Daily Summary: Hourly Summary: Domain Report: Organisation Report: Host Report: Directory Report: Failure Report: Request Report)
This report lists the files that caused failures, for example files not found.
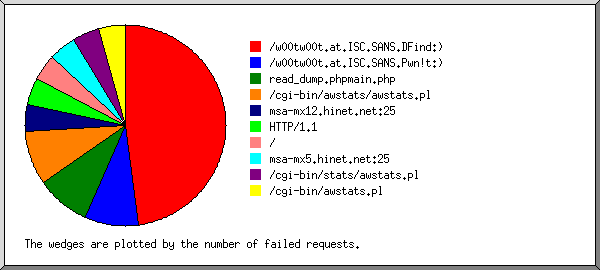
Listing files, sorted by the number of failed requests.
reqs: file
----: ----
  11: /w00tw00t.at.ISC.SANS.DFind:)
   2: /w00tw00t.at.ISC.SANS.Pwn!t:)
   2: read_dump.phpmain.php
   2: /cgi-bin/awstats/awstats.pl
   1: msa-mx12.hinet.net:25
   1: HTTP/1.1
   1: /
   1: msa-mx5.hinet.net:25
   1: /cgi-bin/stats/awstats.pl
   1: /cgi-bin/awstats.pl
(Go To: Top: General Summary: Monthly Report: Weekly Report: Daily Report: Daily Summary: Hourly Summary: Domain Report: Organisation Report: Host Report: Directory Report: Failure Report: Request Report)
This report lists the files on the site.
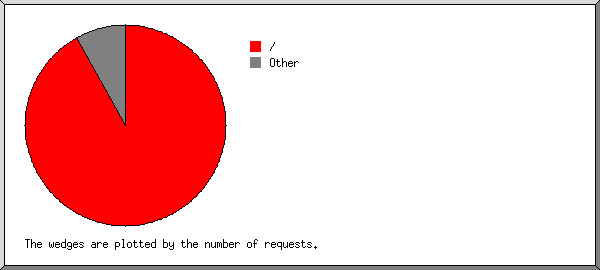
Listing files with at least 20 requests, sorted by the number of requests.
reqs: %bytes:       last time: file
----: ------: ---------------: ----
  23: 90.83%:  5/Oct/07 08:23: /
   2:  9.17%: 21/Sep/07 02:50: [not listed: 2 files]
(Go To: Top: General Summary: Monthly Report: Weekly Report: Daily Report: Daily Summary: Hourly Summary: Domain Report: Organisation Report: Host Report: Directory Report: Failure Report: Request Report)

